A Curious Case of the Missing Measure: Better Scores and Worse Generation
Our field has a secret: nobody fully trusts audio evaluation measures. As neural audio generation nears perceptual fidelity, these measures fail to detect subtle differences that human listeners readily identify, often contradicting each other when comparing state-of-the-art models. The gap between human perception and automatic measures means we have increasingly sophisticated models while losing our ability to understand their flaws.
Preface: The Missing Measure Matters More Than Ever
Something extraordinary happened in audio ML recently that you may have missed: NVIDIA’s BigVGAN v2 achieved generation quality so convincing that finding flaws became remarkably difficult. Not just casual-listening difficult—even critical listening under studio conditions revealed fewer obvious artifacts than we’re used to hunting.
What’s curious is how quietly this advance happened: v2 weights were announced via social media with inconclusive scores published in a cursory blog post months later, all with remarkably restrained technical claims. This disconnect between measured and perceived performance hints at a fundamental challenge facing multiple domains in machine learning: the unknown unknowns in our models and evaluation measures. As our models approach human-level performance, we’re discovering limitations in our ability to systematically detect and characterize errors.
Yet the perceptual quality of BigVGAN v2 speaks for itself—if you simply listen, the improvement is unmistakable. This should be cause for celebration. But the evaluation scores, while showing improvements over BigVGAN v1,
Exhibit A: ESPnet-Codec’s Contradiction
Let’s examine a systematic evaluation of neural audio codecs that crystallizes our challenge. ESPnet-Codec’s authors did everything right: they assembled a careful benchmark corpus (AMUSE), meticulously retrained leading models, evaluated using standard measures, and released a new measures toolkit VERSA.
Let’s dissect what we’re seeing:
| Model | MCD ↓ | CI-SDR ↑ | ViSQOL ↑ |
|---|---|---|---|
| SoundStream | 5.05 | 82.01 | 3.92 |
| EnCodec | 4.90 | 73.14 | 4.03 |
| DAC | 4.97 | 75.84 | 3.90 |
Table 1: AMUSE codec performance comparison on the “audio” test set at 44.1kHz, using SoundStream
At 44.1kHz on the “audio” test set:
- SoundStream achieves the best CI-SDR (82.01).
- Yet EnCodec wins on MCD (4.90) and ViSQOL (4.03).
| Model | MCD ↓ | CI-SDR ↑ | ViSQOL ↑ |
|---|---|---|---|
| SoundStream | 5.60 | 70.51 | 3.93 |
| EnCodec | 5.60 | 65.79 | 3.81 |
| DAC | 5.14 | 65.29 | 3.67 |
Table 2: AMUSE codec performance comparison on the “music” test set at 44.1kHz, using SoundStream
Now the music results get more peculiar:
- DAC has the lowest MCD (5.14).
- SoundStream reverses this pattern for the other two measures.
Overall, the measures fundamentally disagree about ranking. These contradictions have real impact. When ViSQOL suggests one winner and CI-SDR another, which should they trust? More fundamentally, as these models approach human-level quality, how do we systematically identify their remaining flaws? And perhaps most provocatively: What happens when our measures agree but miss perceptually significant differences?
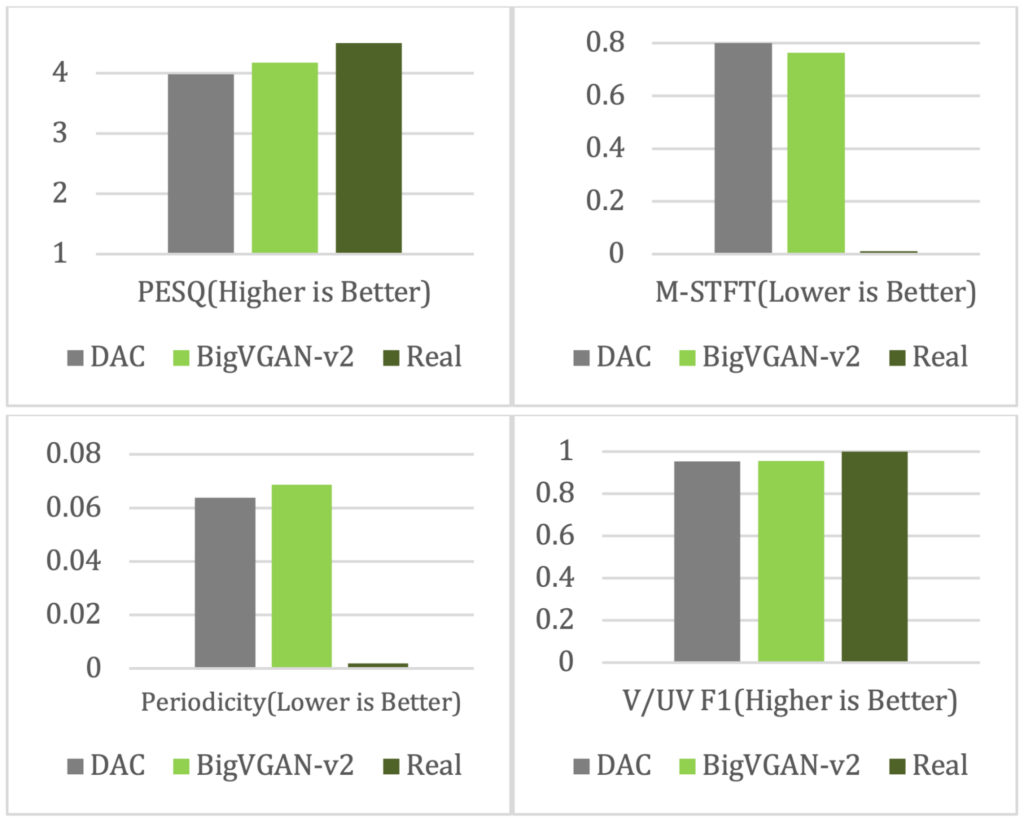
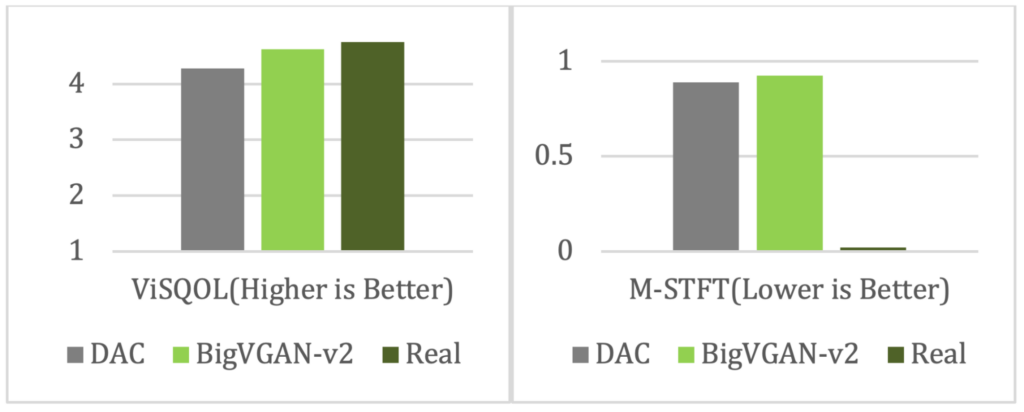
If this feels like an isolated example, consider NVIDIA’s recent BigVGAN v2 announcement. Their blog post presents comparisons against DAC using a similar zoo of measures: PESQ, ViSQOL, Multi-scale STFT, periodicity RMSE, and voiced/unvoiced F1 scores. The results are presented only as relative graphs without absolute numbers, but they tell a similar story—different measures suggesting different winners depending on the task and sampling rate. For speech at 44kHz, some measures favor BigVGAN v2, others DAC. For music, the story is equally complex.

Figure 1: BigVGAN v2 44 kHz versus Descript Audio Codec results using HiFi-TTS-dev speech data.

Figure 2: BigVGAN v2 44 kHz versus Descript Audio Codec results using MUSDB18-HQ music data.
What’s missing from all these evaluations? One clear measure that captures what we actually care about: human auditory perception of the output. Without it, we’re left with a zoo of measures that sometimes agree, sometimes contradict, and often leave us wondering what they’re really measuring.
The Investigation
The Gold Standard: Human Evaluation
Human evaluation remains the gold standard for audio quality assessment, but evaluating perceptual similarity presents specific challenges. Prior work has identified several key considerations in experimental design:
- Reference system bias can systematically affect similarity judgments
- Training listeners requires careful methodology to ensure consistent criteria
- Even small protocol variations can significantly impact results
Beyond methodological challenges, human evaluation at scale faces practical constraints. Large-scale listening tests require significant time investment, both from expert listeners and researchers. This makes it difficult to uncover unknown unknowns—subtle errors that only become apparent through extensive human listening. The cost scales with the number of model variants and hyperparameter configurations being tested. While essential for final validation, relying solely on human evaluation can significantly impact research iteration cycles.
Beyond Metrics: The Research Cycle
Researchers have several options for integrating evaluation into their experimental cycle:
- Compare multiple automatic measures
- Calibrate measures interpretations through experience-based intuition
- Spot-check with informal listening
- Run formal listening tests at milestones
- Develop custom internal evaluation methods
Each approach represents different trade-offs between speed, reliability, and resource requirements.
Probing the Perceptual Boundary
Audio evaluation traditionally relies on two established audio similarity protocols: Mean Opinion Score (MOS), where listeners rate individual samples on a 1-5 scale, and MUSHRA, an ITU standard for rating multiple samples against a reference on a 0-100 scale. There are a handful of difficulties in audio similarity judgment
- Rating tasks require implicit decisions about what constitutes “highly similar” versus “not similar at all”
- The presence of other comparisons systematically affects how ratings are assigned
- Similarity judgments involve an active search process rather than a simple feature comparison
- Different measures of similarity (ratings, confusion errors, reaction times) often show only modest correlation
Our investigation focuses on a simpler question: Can listeners detect any difference between the reference and reconstruction? Rather than asking “how different?”, we ask “detectably different or not?” This binary framing provides cleaner signal about perceptual boundaries while requiring less annotator training. For this binary perceptual discrimination task, we adopted two complementary Just Noticeable Difference (JND) protocols:
Two-Alternative Forced Choice (2-AFC/AX) presents listeners with a reference and reconstruction in known order, requiring a binary judgment: “Do you hear a difference?”. While 2-AFC offers intuitive comparison with minimal cognitive load and clear Just Noticeable Difference (JND) criteria, it introduces reference bias and suffers from high false positive rates (50%) under random guessing. More subtly, response bias under uncertainty varies systematically with reconstruction quality—listeners tend to default to “similar” with high-quality samples but “different” with lower-quality ones, creating a complex interaction between model performance and evaluation reliability.
Three-Alternative Forced Choice (3-AFC/Triangle) takes a different approach, presenting three samples (the reference once and the reconstruction twice, or vice-versa) in blind random order and asking listeners to identify the outlier. This protocol elegantly controls for response bias by eliminating the privileged reference and maintains high sensitivity while requiring less cognitive load than industry standards like MOS and MUSHRA. However, 3-AFC introduces its own complexities: increased cognitive demand compared to 2-AFC and a fixed 1/3 false positive rate for imperceptible differences.
Both criteria focus on binary perceptual difference detection rather than similarity scoring, reducing the subjectivity inherent in rating scales while providing complementary perspectives on near-threshold perceptual differences.
Dataset and Model Selection
We evaluated two models that represent different approaches to universal audio generation: NVIDIA’s BigVGAN v2 (a universal neural vocoder) and the Descript Audio Codec (DAC). At the time of writing, DAC represents the strongest published baseline for universal audio generation with available weights, with comprehensive evaluations across multiple domains and strong performance on standard measures.
While many universal generative audio ML models use AudioSet for training, this dataset is based on busy audio scenes (YouTube clips) and can be difficult to obtain. Instead, our investigation used FSD50K.
Annotation Protocol
We conducted an informal formal listening test: structured protocol, three annotators, controlled conditions—but a limited sample size, single duration of audio tested, and authors among the listeners. This approach struck a balance between rigor and practicality.
We first selected 150 one-second audio segments from the FSD50K test set.
We selected 1-second segments as a practical trade-off between annotation efficiency and stimulus completeness. While humans can recognize many sound categories from extremely brief segments—voices in just 4ms and musical instruments in 8-16ms
Results
Our investigation uses both AX and 3AFC protocols to assess perceptual differences between reference and generated audio. Each protocol reveals different aspects of perceptual detection:
AX (2AFC) introduces response bias—listeners tend to non-systematically over- or under-report differences based on experimental conditions, model quality, and personal factors. We’ve observed in previous work the phenomenon of the audio engineer who reports super hearing and systematically labels every pair as “different”. With very high quality audio, listeners in the current study reported defaulting to “similar” when uncertain. This creates uncertain label noise that varies with audio quality and individual differences. While sentinel annotations (known-answer questions) traditionally control for annotator reliability, this approach becomes less effective when the underlying perceptual distribution is unknown or actively shifting, for example in active learning settings where model behavior and artifacts evolve throughout training.
3-AFC testing has a fixed 1/3 false positive rate under random guessing, which occurs when audio differences are imperceptible. We statistically correct our detection measurements. Given observed detection rate \(P_{\text{obs}}\), we report true detection rate \(P_{\text{true}} = \frac{3P_{\text{obs}} - 1}{2}\). This correction maps chance performance (\(P_{\text{obs}} = \frac{1}{3}\)) to zero (\(P_{\text{true}} = 0\)) and perfect performance (\(P_{\text{obs}} = 1\)) to one (\(P_{\text{true}} =1\)).
Metrics vs. Perception
Our perceptual evaluation reveals two key findings: (1) a quality gap between the models, and (2) near-random guessing by traditional audio distance measures.
BigVGAN v2 achieves higher perceptual fidelity, with over 80% of samples indistinguishable from reference under both protocols. DAC achieves perceptual fidelity on 69.1 or 58.9% of samples, depending upon the choice of protocol:
| % Perceptually Indistinguishable | ||
|---|---|---|
| AX | 3-AFC | |
| BigVGAN v2 | 80.2% | 85.3% |
| DAC | 69.1% | 58.9% |
Table 3: Model Performance Under Different Perceptual Protocols. Percentage of audio samples judged perceptually indistinguishable from reference under both testing protocols.
Second, traditional measures fail to capture these perceptual differences:
| Metric | AUC-ROC ↑ | AUC-ROC ↑ | Spearman ↑ | Spearman ↑ |
|---|---|---|---|---|
| AX | 3-AFC | AX | 3-AFC | |
| Human vs Others | 0.750 ± 0.032 | 0.713 | 0.495 ± 0.062 | 0.427 |
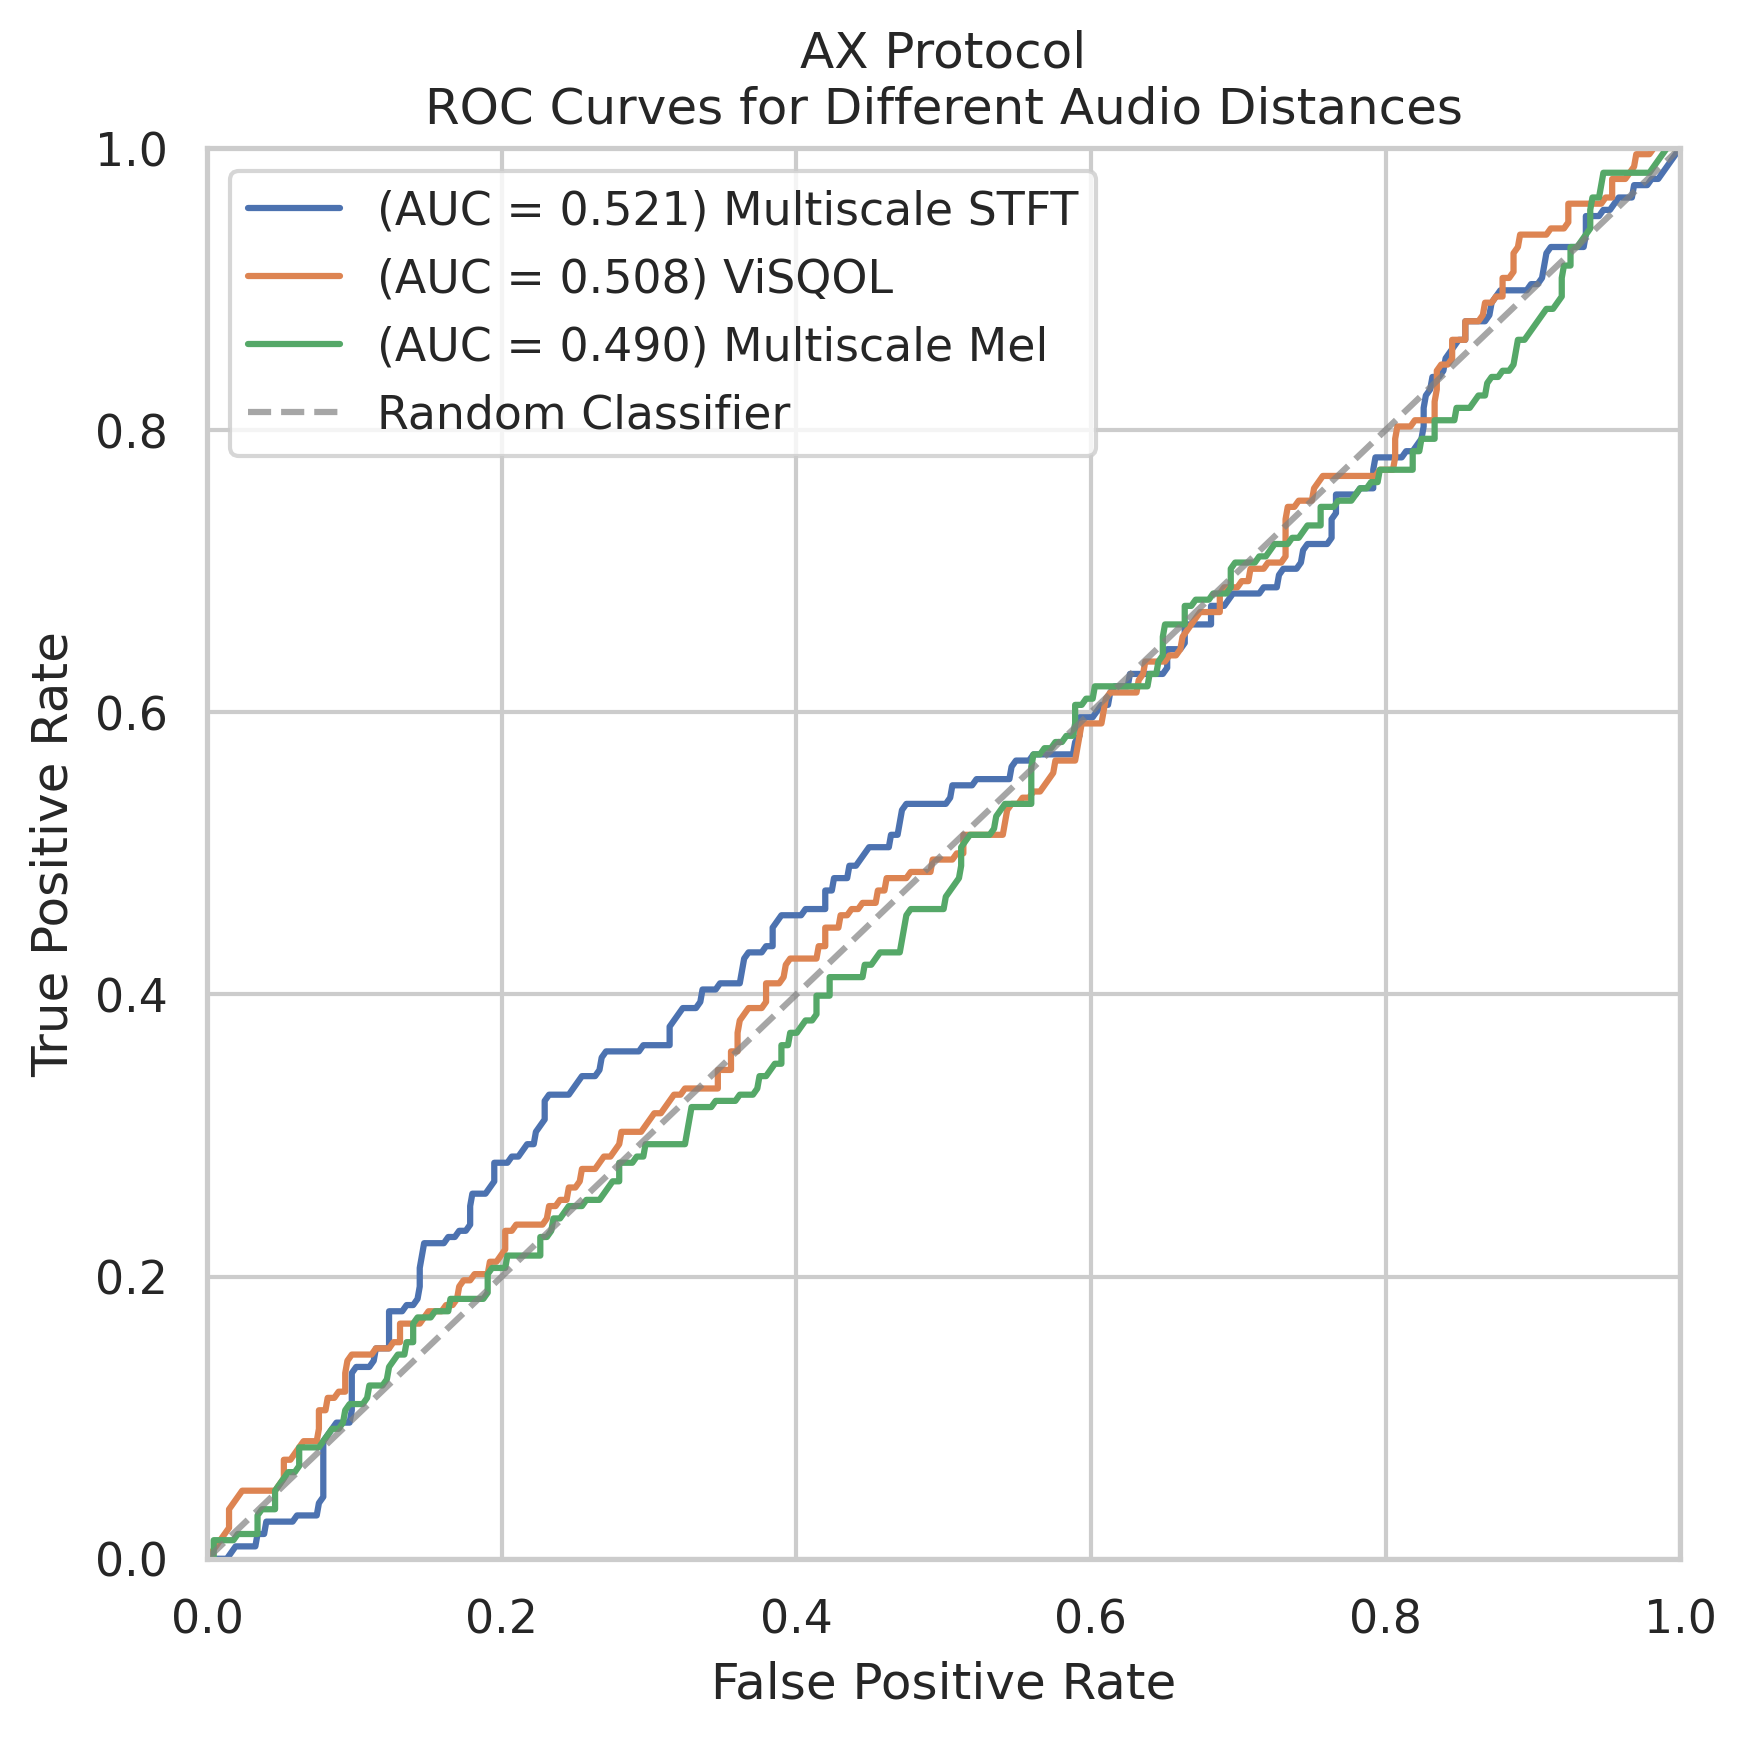
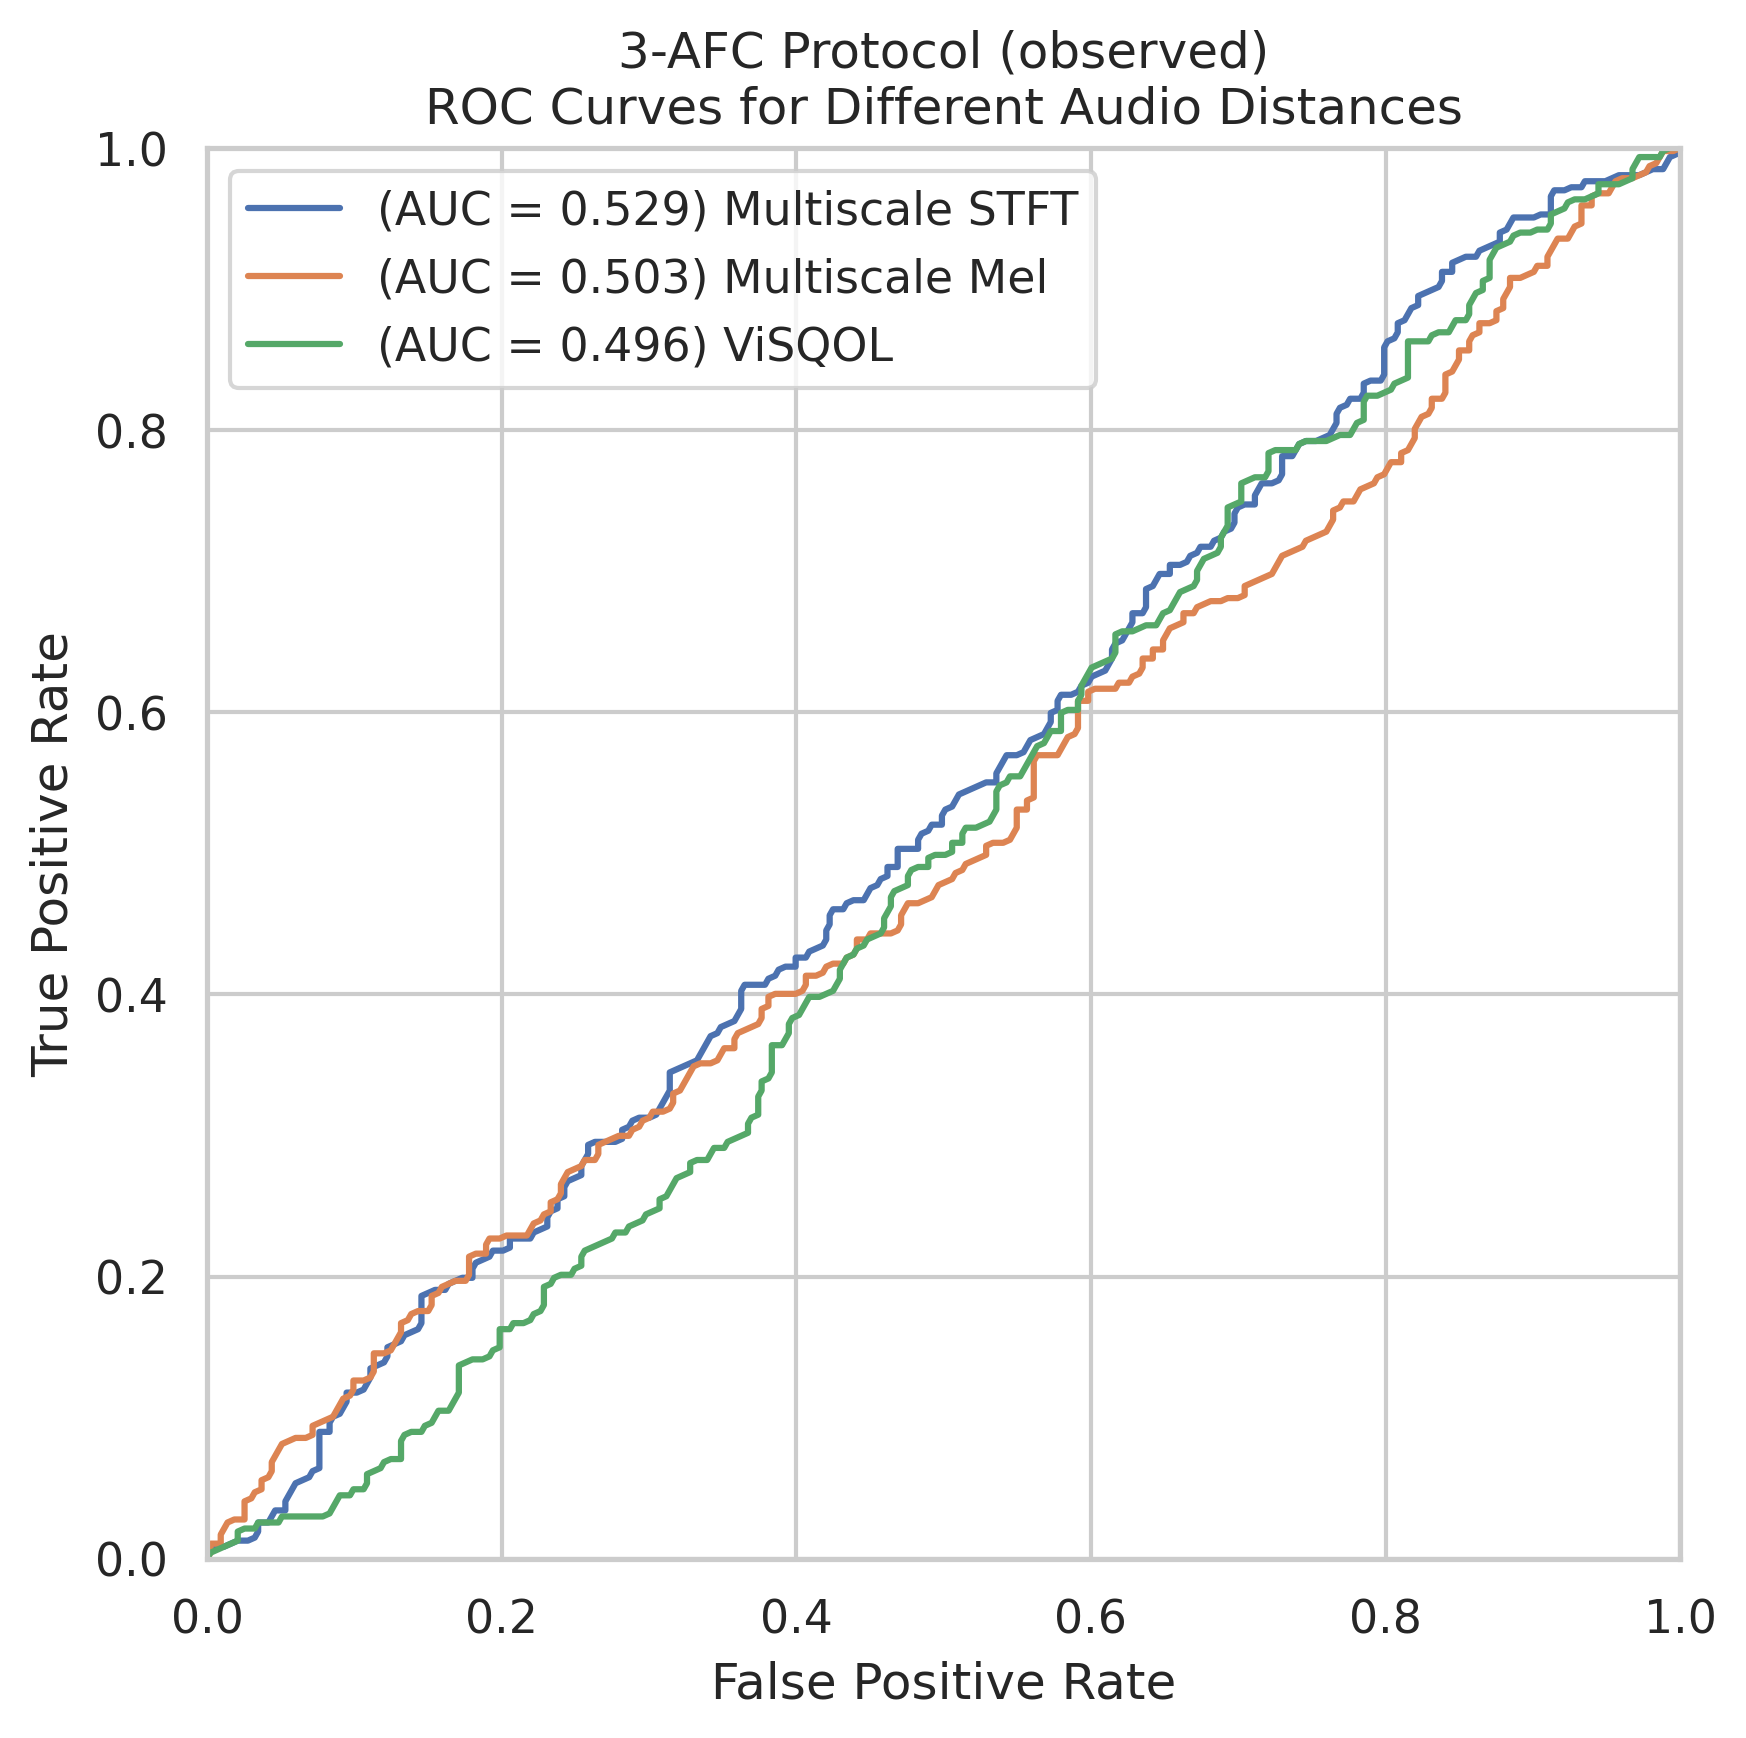
| Multi-scale STFT | 0.521 ± 0.047 | 0.529 | 0.032 ± 0.070 | 0.049 |
| ViSQOL | 0.508 ± 0.045 | 0.496 | 0.012 ± 0.067 | -0.007 |
| Multi-scale Mel | 0.490 ± 0.044 | 0.503 | -0.014 ± 0.066 | 0.006 |
Table 4: Automatic and Human Evaluation Performance. AUC-ROC scores and Spearman correlations comparing automatic measures against human judgments, with 95% confidence intervals for AX protocol. We use the same multi-scale STFT and Mel hyperparameters as the DAC paper.
Despite using multi-scale decomposition and psychoacoustic modeling, even the best automatic measure (multi-scale STFT) barely outperforms random chance.
The ROC curves illustrate this stark reality: as neural audio approaches perceptual fidelity, traditional evaluation measures fail to capture the differences humans reliably detect.


Figure 3: ROC Curves for Distance Measures. ROC curves for three standard audio distance measures (multi-scale STFT, multi-scale Mel, and ViSQOL) evaluated against (A) AX and (B) 3-AFC human judgments.
The ROC curves provide striking visual evidence of how traditional distance measures fail to discriminate perceptual differences in high-quality audio. All three measures barely deviate from the random classifier diagonal. When neural models approach perceptual fidelity, even psychoacoustically-motivated measures show no correlation with human judgments (Spearman correlations from -0.014 to 0.032). While human annotators demonstrate clear discriminative ability (0.713–0.750 AUC-ROC), even our best automatic measure (multi-scale STFT) barely outperforms random chance. This suggests we’ve reached a regime where traditional audio evaluation measures no longer provide meaningful signal.
Unknown Unknowns: Qualitative Analysis
Both models represent a significant advance in universal neural audio generation. The majority of their outputs are perceptually indistinguishable from the reference audio, with BigVGAN v2 achieving over 80% perceptual fidelity—an unprecedented result that necessitated new evaluation methods to understand the remaining artifacts.
Harmonic Errors: The most frequently observed artifact is harmonic content errors, which manifested as inaccuracies in the reproduction or thinning of harmonic structures. This is especially evident in musical tones and resonant sounds, where models sometimes produced subtle harmonic distortions, failed to capture upper harmonics fully, or introduced spurious mid-high frequency content, resulting in timbres that felt “thinner” than their references.
Lower your volume!
| Reference | DAC |
|---|---|
Pitch Errors: We also identify phase and pitch instability, most evident in sustained tones, metallic resonances, or low-frequency content. This results in occasional warbling or pitch inconsistencies, which were subtle but perceptually significant in specific contexts like bell tones or long-held notes.
| Reference | BigVGAN v2 |
|---|---|
Temporal Smearing: Another common issue is temporal definition loss, characterized by a smearing of sharp transients and a lack of micro-temporal detail in complex textures. This is particularly noticeable in very fast rhythmic or periodic sounds (e.g., electronics with a motor), where attacks became diffuse or textures such as water-like recordings lost clarity. BigVGAN v2, while generally strong, exhibits slightly more pronounced issues in these areas, sometimes rendering fast transients as noise-like smears.
| Reference | BigVGAN v2 |
|---|---|
Background Noise: Reproduction inconsistencies in background noise were another notable artifact. These range from over-amplification of noise floors, which could make outputs feel overly “hissy,” to under-generation, where the model acted like a de-noiser.
| Reference | DAC |
|---|---|
Other artifacts also occasionally surface, including some clipping distortion and the rare audio dropout. We notice some effects resembling dynamic range processing, such as compression effects, which alter the perceived loudness relationships between elements or reduce dynamic contrast. While rare, such changes are noticeable in specific, layered sounds and occasionally impacted the perceived balance of complex scenes. Separation between sound sources is occasionally blurred, creating muddy-sounding mixes and impacting the clarity of the reconstruction.
These qualitative results suggest that detecting perceptual differences in this high-quality regime requires modeling nonlinear combinations of audio phenomena, rather than linear combinations of spectral features. This may explain why current spectral distance measures show limited sensitivity. These results also underscore the impressive quality of current models and highlight nuanced areas where further refinement is needed.
Look at Vision: A Path Forward
Recent work by Sundaram et al.
Audio presents both advantages and unique challenges:
Harder:
- Richer distortion space (EQ, compression, reverb, modulation)
- Complex time-frequency interactions and phase relationships
- Sequential listening requirement versus parallel visual comparison
Easier:
- Stronger psychoacoustic foundations from decades of research
- More diverse pretrained models (Wav2Vec2, HuBERT, CLAP, MERT)
- Better theoretical understanding of human perception
This suggests a focused path forward: strategic sampling around perceptual boundaries, active learning
Conclusion
Traditional psychoacoustics has served us well. Decades of research into human auditory perception produced evaluation measures that effectively captured obvious artifacts from earlier models.
But as neural audio approaches perceptual fidelity, we face a stark reality: these measures fail to capture the subtle differences humans reliably detect. Our work demonstrates the challenge of discovering unknown unknowns in the high-quality audio regime—systematic failure modes in both models and evaluation measures that become harder to detect as quality improves. Examining DAC and BigVGAN v2, we found:
- High perceptual quality—over 80% of BigVGAN v2 samples are indistinguishable from reference.
- Traditional measures performing near chance level when evaluating high-quality audio.
- Similar measure distances for both perceptually distinguishable and indistinguishable differences, where there was human consensus about perceptual differences.
Perhaps the next breakthrough in audio generation won’t come from a new architecture, but from understanding how to measure what we’ve built. We invite the community to join us in developing better tools for understanding when and how our models fail.