Bridging the Modality Gap: Enhancing Document Retrieval with Multimodal Embeddings
In an era where documents seamlessly blend rich textual and visual content, traditional retrieval systems often fall short. This post explores how Multimodal Embeddings bridge the modality gap, introducing advanced models such as VISTA and ColPali, along with innovative evaluation methods, enhanced model interpretability, and an analysis of their performance.
In today’s data-driven world, the volume and complexity of information have grown exponentially. Documents are no longer confined to plain text; they now encompass a rich blend of images, charts, tables, and intricate layouts. This evolution presents a significant challenge: How do we effectively retrieve and analyze information from such complex, multimodal documents?
Traditional retrieval systems, primarily designed for text-only data, often falter when faced with this complexity. They struggle to extract and interpret the valuable information embedded within various modalities. This limitation hampers our ability to harness the full potential of the data at our disposal.
Enter Multimodal Embeddings—an innovative approach that leverages both textual and visual data to revolutionize document retrieval. By bridging the modality gap between different data types, MVS(MultiModal Vector Search) promises to make information retrieval more accurate and efficient than ever before.
In this blog post, we’ll delve into:
- The unique challenges that modern, complex documents pose for retrieval tasks.
- The limitations of traditional text-only and vision-only models.
- Understanding the modality gap and its impact on multimodal retrieval.
- Exploring cutting-edge multimodal models like VISTA
and ColPali . - Investigating the interpretability, with empirical results showcasing model performance.
- Novel benchmarking strategies designed to evaluate these advanced models effectively.
Introduction

With the rise of sophisticated document formats that integrate text, images, and complex layouts has rendered traditional text-based retrieval systems inadequate. The richness of multimodal documents requires systems that can understand and process multiple data types simultaneously. The modality gap—the disconnect between different types of data representations—poses a significant hurdle in achieving effective retrieval
To bridge this gap, advanced multimodal systems are essential. By aligning and embedding various data types, these systems not only interpret complex documents but also open doors to more powerful, nuanced information retrieval across diverse formats.
Challenges in Document Retrieval

Modality-Specific Challenges
Retrieving information from today’s complex documents is a multifaceted problem that requires a nuanced approach. Documents now often contain:
- Text: Dense paragraphs, bullet points, and annotations.
- Images: Photographs, diagrams, and illustrations.
- Tables and Charts: Structured data representations.
- Complex Layouts: Multi-column formats, sidebars, and embedded multimedia.
Each modality presents unique technical obstacles:
- Textual Data:
- Language Ambiguity: Synonyms, homonyms, and context-dependent meanings.
- Multilingual Content: Documents may contain multiple languages or dialects.
- Visual Data:
- Image Quality: Low-resolution images can hinder recognition.
- Complex Visuals: Diagrams and charts may contain dense information that’s hard to parse.
- Structural Layout:
- Non-linear Reading Paths: Multi-column texts and inserts can confuse linear text processors.
- Embedded Elements: Images and tables interwoven with text complicate parsing.
Addressing these challenges requires advanced retrieval systems that are capable of seamlessly integrating and processing each modality, making it possible to extract meaningful insights from even the most complex document formats.
Modality Gap
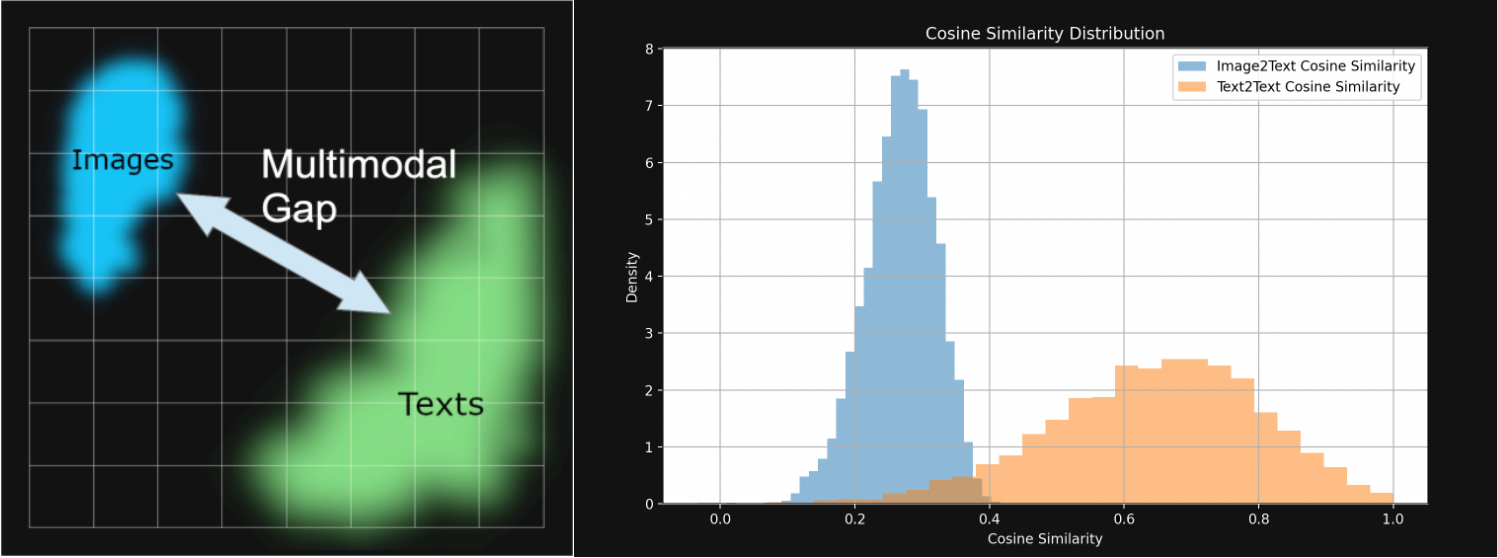
The modality gap refers to the disconnect between text and image embeddings in multimodal models. Despite shared semantic objectives, these embeddings often occupy distinct regions in the space, making it difficult for models to relate information across modalities
Causes of the Gap
- Separate Embedding Spaces: Text and images are encoded differently, forming distinct clusters.
- Contrastive Learning Bias: Training inadvertently emphasizes modality-specific features.
- Initialization Bias: Pretrained encoders begin with cone-shaped distributions, reinforcing separation.
Evidence from Flickr8k Dataset
Using 1,000 text-image pairs from the Flickr8k test set, each pair consists of a single image and five caption texts, all describing the same image. Embeddings were generated for both the texts and the image, and cosine similarity was calculated and visualized.
- Cosine Similarity: Text-text pairs had higher similarity than image-text pairs, despite semantic overlap.
- Visualization: Embeddings from the Flickr8k dataset showed clustering into distinct text and image regions.
Implications
- Retrieval Challenges: Models may retrieve documents that match in one modality but are irrelevant in another.
- Increased Complexity: Bridging this gap demands advanced architectures and computational resources.
For more details on the Modality Gap, refer to this article.
Limitations of Traditional Models
Text-Based Models
Text-based retrieval models—leveraging techniques like TF-IDF, BM25, and transformer-based embeddings such as BERT—have been the cornerstone of information retrieval. They excel at understanding and retrieving information when text is the primary medium.
Limitations:
- Blind to Visual Content: Unable to interpret images, charts, or layouts.
- Ignoring Spatial Relationships: Can’t understand the importance of where text appears in a document.
- Struggling with Non-Linear Layouts: Fail to process documents with complex formatting.
Vision-Based Models
Vision-based retrieval models, utilizing architectures like convolutional neural networks (CNNs) or vision transformers (e.g., ViT, Swin Transformer), extract features from visual content, focusing on images, diagrams, and spatial layouts.
Limitations:
- Text Interpretation: Struggle with reading or understanding embedded text within images.
- Fine-Grained Details: May overlook small fonts or intricate details in complex diagrams.
- Semantic Gap: Lack understanding of the textual semantics associated with visual elements.
Advanced Evaluation Metrics for Ranking
Evaluating retrieval systems, especially those handling multimodal data, demands metrics that account for both relevance and ranking position.
Mean Reciprocal Rank (MRR)
Definition: The MRR measures how quickly a system retrieves the first relevant document.
\[\text{MRR} = \frac{1}{|Q|} \sum_{i=1}^{|Q|} \frac{1}{\text{rank}_i}\]Where:
- \(( Q )\) is the number of queries.
- \(( {rank}_i )\) is the rank position of the first relevant document for the ( i )-th query.
Importance:
- User Satisfaction: Higher MRR indicates users find relevant documents sooner.
- System Efficiency: Reflects the system’s ability to prioritize relevant results.
Normalized Discounted Cumulative Gain (nDCG)
Definition: nDCG evaluates ranking quality by considering the position of relevant documents and assigning higher importance to top-ranked results.
\[\text{nDCG}_p = \frac{1}{\text{IDCG}_p} \sum_{i=1}^p \frac{2^{\text{rel}_i} - 1}{\log_2(i+1)}\]Where:
- \(( p )\) is the number of results considered.
- \(( {rel}_i )\) is the relevance score of the result at position ( i ).
- \(( {IDCG}_p )\) is the ideal DCG up to position ( p ).
Importance:
- Relevance and Rank: Balances both factors to provide a holistic evaluation.
- Comparison Across Queries: Normalization allows for fair comparison between different queries.
Mean Average Precision (MAP)
Definition: MAP computes the mean of average precision scores across all queries.
\[\text{MAP} = \frac{1}{|Q|} \sum_{q \in Q} \frac{1}{n_q} \sum_{k=1}^{n_q} \text{Precision}(k) \times \text{rel}(k)\]Where:
- \(( {n}_q )\) is the number of retrieved documents for query ( q ).
- \(( {Precision}(k) )\) is the precision at cutoff ( k ).
- \(( {rel}(k) )\) is a binary indicator of relevance at position ( k ).
Importance:
- Comprehensive Evaluation: Accounts for all relevant documents, not just the first.
- Balanced Metric: Reflects both precision and recall across the ranking.
Recent Advancements in Multimodal Retrieval Models
VISTA: Vision-Augmented Text Embeddings
Overview:
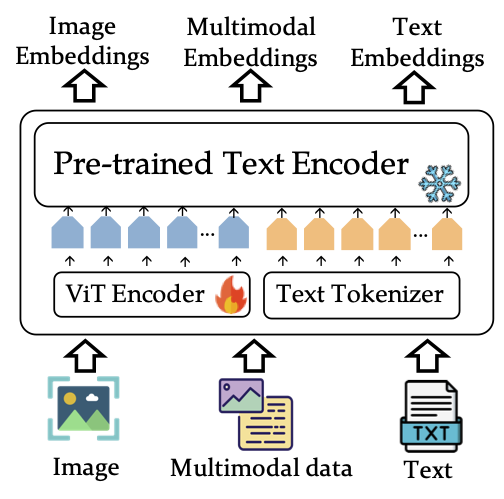
VISTA (Visualized Text Embedding For Universal Multi-Modal Retrieval) is a model that aims to enhance text embeddings with visual information, effectively bridging the modality gap.
How VISTA Works:
- Visual Token Embedding: Introduces visual tokens derived from document images into the text embedding space.
- Extension of Text Encoders: Enhances pre-trained text models (like BERT) by adding a visual component.
- Multi-Stage Training:
- Alignment Phase: Aligns visual tokens with textual tokens using a large corpus.
- Fine-Tuning Phase: Trains on composed image-text data for multimodal representation capability.
Strengths:
- Improved Retrieval Accuracy: Enhances understanding of documents with embedded images.
- Compatibility: Works with existing text encoders.
- Efficiency: Avoids the need for extensive retraining.
Limitations:
- Dependency on Visual Quality: Performance may degrade with low-quality images.
- Complexity in Token Integration: Requires careful balancing to prevent one modality from dominating.
ColPali: Efficient Document Retrieval with Vision Language Models
Overview:
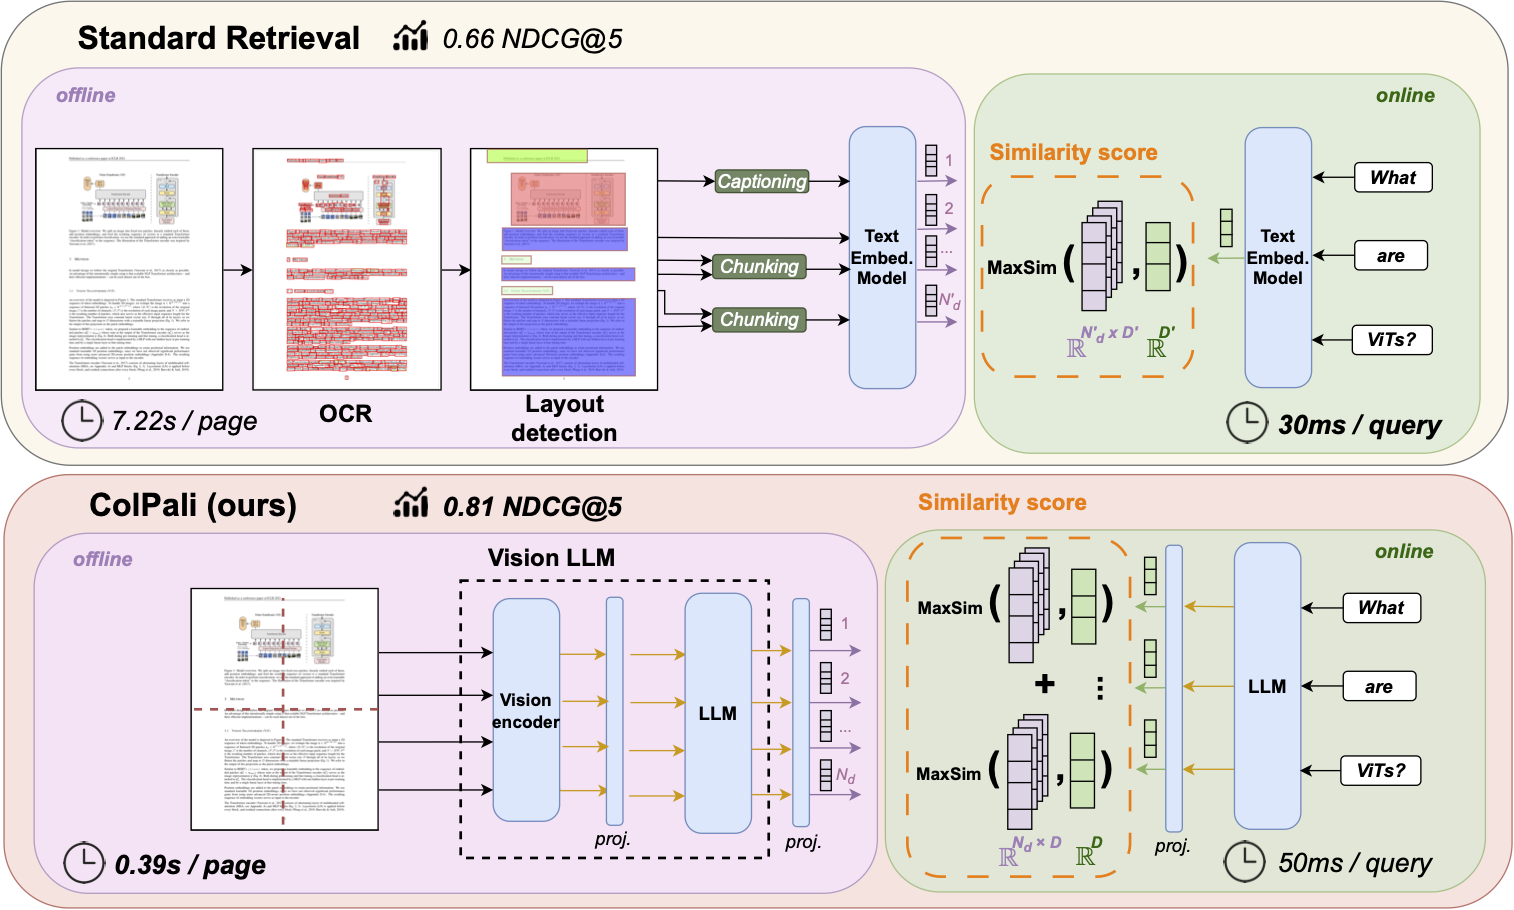
ColPali is a state-of-the-art multimodal retrieval model that leverages Vision-Language Models (VLMs) to create a unified embedding space for text and images.
How ColPali Works:
- Vision-Language Integration: Uses a dual-encoder architecture with separate encoders for text and images.
- Late Interaction Mechanism: Retains individual token embeddings for richer interactions.
- Elimination of OCR Bottleneck: Processes images directly, capturing both textual and visual information without OCR.
Strengths:
- Effective Modality Bridging: Creates a shared space for all modalities.
- Enhanced Retrieval Performance: Excels in retrieving documents with complex layouts.
- Interpretability: Allows for analyzing which tokens contribute most to the retrieval score.
Limitations:
- Computational Demands: Training VLMs is resource-intensive.
- Data Requirements: Requires large amounts of multimodal data.
- Potential Overfitting: May overfit to specific layouts or styles.
Interpretability of Advanced Models in Documents
Importance of Interpretability
Understanding how a model like ColPali makes retrieval decisions is crucial, particularly in sensitive domains like finance, where accuracy and accountability are paramount.
- Transparency: By identifying the specific document regions influencing retrieval, ColPali provides clear insights into its decision-making process, fostering user trust.
- Debugging: The ability to pinpoint errors allows developers to refine and optimize the model effectively.
Generating Heatmaps Using Attention Mechanisms
Models leverages attention mechanisms to produce interpretable heatmaps that highlight the most relevant regions of a document in response to a query. By computing attention scores between query tokens and image patches, the model identifies which parts of the document image are most influential in the retrieval process.
How Heatmaps are Generated:
- Image Patches and Query Tokens: The document image is divided into fixed-size patches, and the query is broken down into individual tokens.
- Embedding Computation: The model computes embeddings for both the image patches and the query tokens using its vision and language encoders.
- Attention Score Calculation: Attention scores are calculated by taking the dot product between each query token embedding and each image patch embedding.
- Normalization and Mapping: These scores are normalized to highlight the most significant interactions and are mapped back onto the spatial layout of the image patches.
- Visualization: The normalized attention scores are overlaid onto the original document image, creating heatmaps that visually represent the areas of focus for each query token.
This approach provides a transparent way to understand which parts of the document are most relevant to the query, combining both textual and visual information.
Heatmap Insights: Case Studies
Example 1: Alibaba’s 10-K Report
- Query: “What are the artificial intelligence tools being developed?”
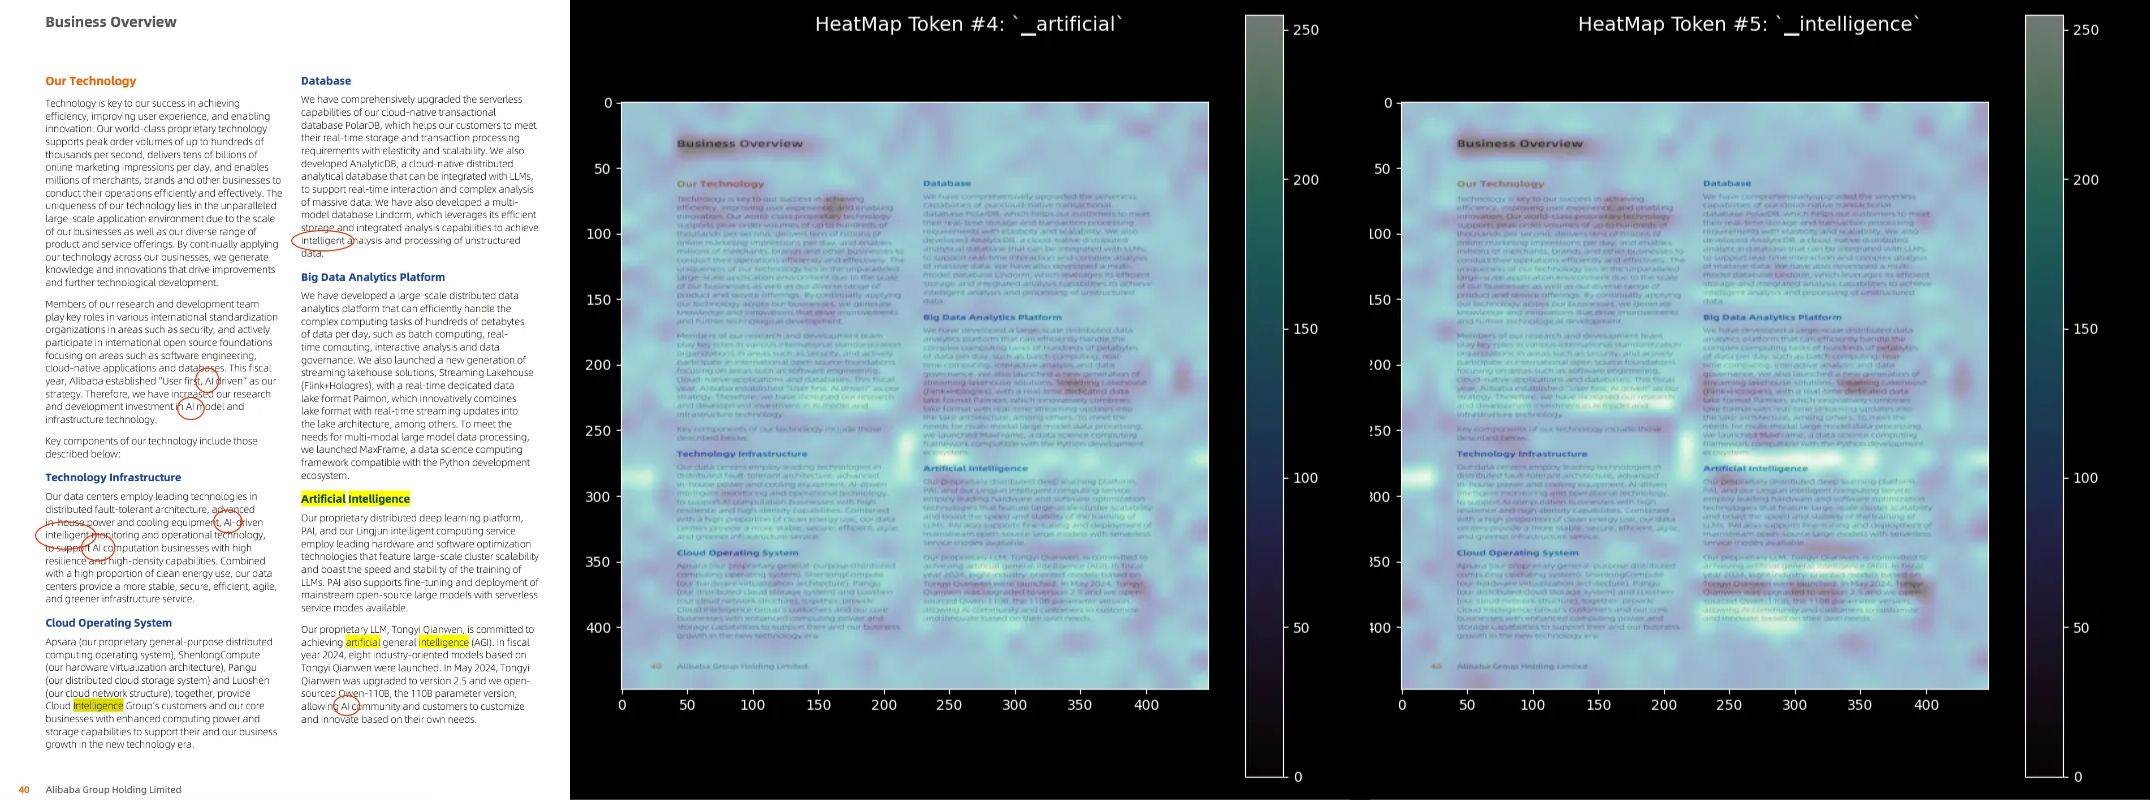
- Results: ColPali retrieved relevant sections emphasizing AI tools and infrastructure, such as “AI-driven infrastructure” and “intelligent monitoring.”
- Explanation: The heatmaps show that the model’s attention is concentrated on areas containing the terms “artificial” and “intelligence,” as well as related phrases like “AI” and “intelligent.” This indicates that ColPali effectively aligns query tokens with corresponding regions in the document image, highlighting its ability to interpret both textual content and visual context.
Example 2: Royal Bank of Canada’s Annual Report
- Query: “Describe the elements of stock-based compensation.”
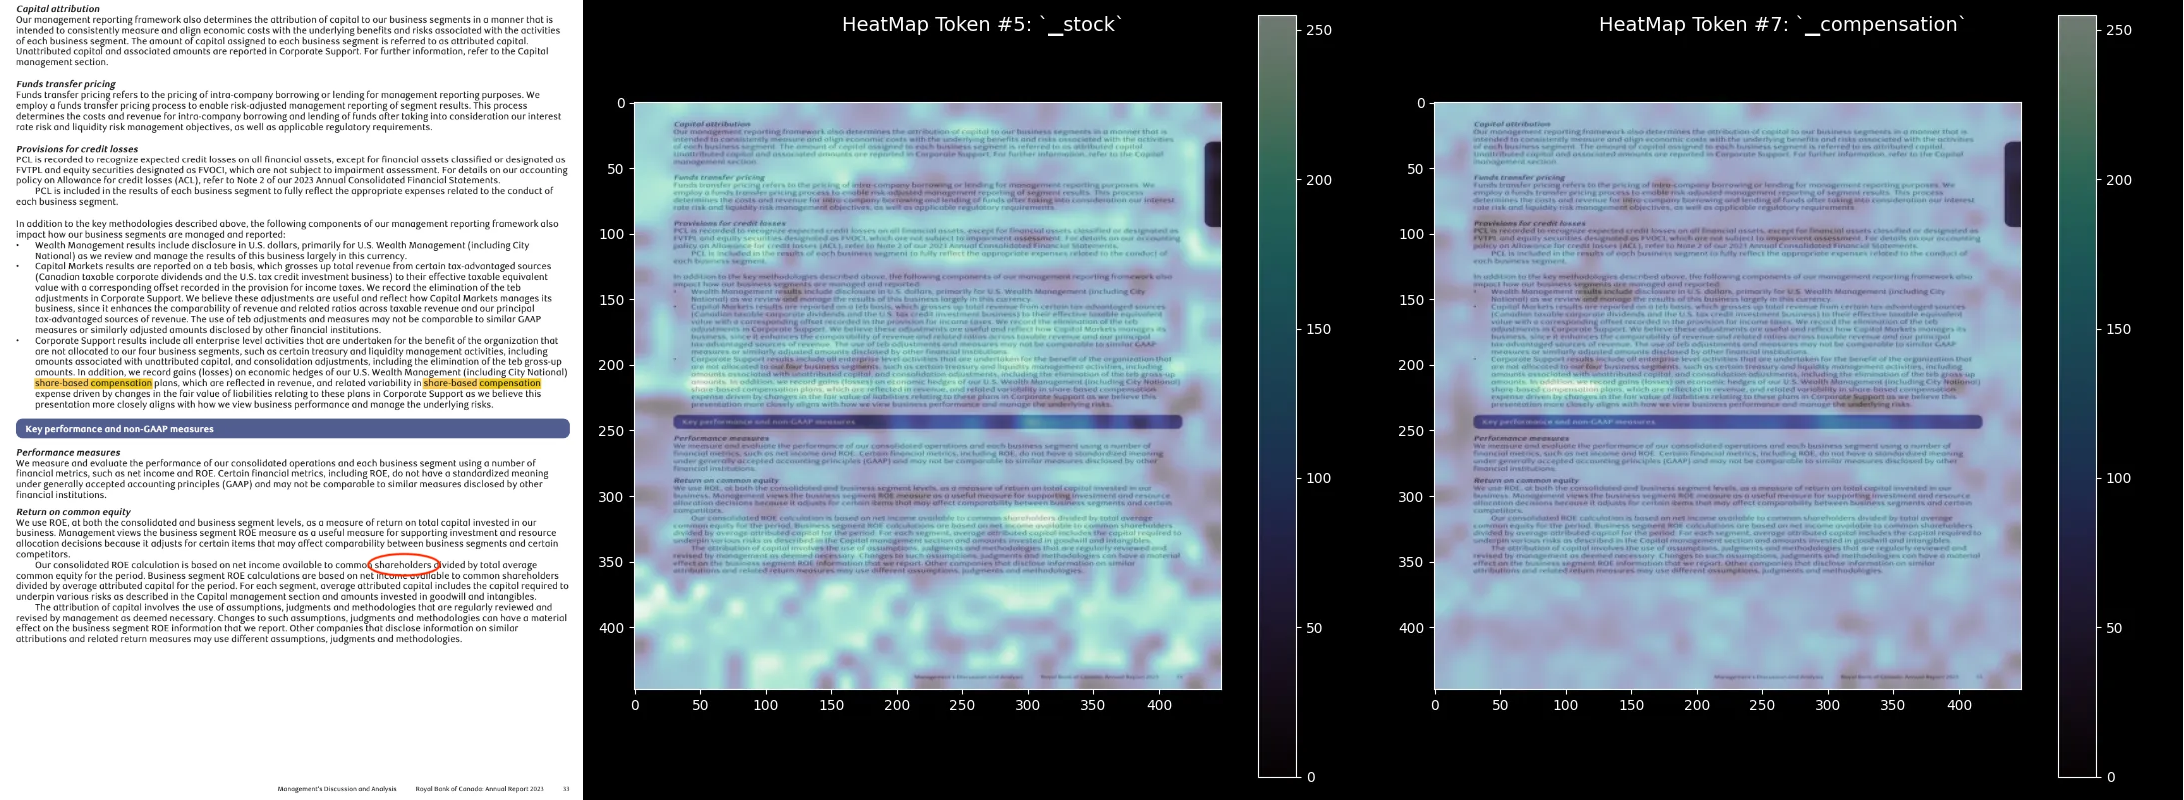
- Results: Pages discussing “stock-based compensation plans” and related financial methodologies were retrieved.
- Explanation: The heatmaps reveal that the model focuses on sections containing the words “stock,” “compensation,” and related terms like “share-based” and “shareholders.” Even when the text appears in smaller fonts or footnotes, the model effectively identifies these areas. This demonstrates ColPali’s capability to extract precise financial details from complex document layouts by leveraging attention mechanisms.
These examples showcase how ColPali’s use of attention-based heatmaps provides interpretable insights into its retrieval decisions, highlighting the relevance between query tokens and document regions.
For more details on the interpretability and the underlying code, refer to this article.
Innovative Evaluation Methods (Simple yet Effective)
Feature Search Experiments
Objective:
Assess how effectively models generate embeddings that capture similarities between documents across modalities.
Methodology:
- Embedding Extraction: Used models like BGE-M3, VISTA, ColPali, and ColQwen.
- Similarity Computation: Calculated cosine similarity between document embeddings.
- Evaluation Metrics: Employed metrics such as Precision@K, Recall@K, MRR, MAP, and nDCG.
Results:
- Text-Based Models: High precision when text is the differentiator but struggled with visual nuances.
- Multimodal Models: Outperformed in tasks where visual context is important, effectively capturing both textual and visual similarities.
Feature Similarity Experiments
Objective:
Evaluate the usefulness of embeddings in differentiating between various document types.
Methodology:
- Prototype Vectors Generation: Created prototype vectors for each document category (e.g., invoices, contracts, reports) representing the “center” of the embedding space for that class.
- Similarity with Cluster Centers: Compared new document embeddings to these prototype vectors using cosine similarity, classifying each document into the category with the highest similarity score.
- Evaluation Metrics: Used metrics such as Accuracy and Recall to assess how well the embeddings captured similarities within categories and differences between them.
Findings:
- Text-Based Models: Effectively categorized documents with distinct textual content.
- Multimodal Models: Performed better when visual and layout information were crucial for classification, highlighting their ability to capture complex document features.
Interactive Embedding Visualization
Below is an interactive t-SNE plot showing document embeddings colored by category. This visualization provides insights into how different models (e.g., VISTA, ColPali, SigLIP) represent document categories (e.g., forms, invoices, identity documents). The embeddings are displayed in a two-dimensional space, highlighting clustering patterns and category separations.
This additional visualization allows for a deeper understanding of how well multimodal models differentiate between document types, bridging the modality gap through effective embedding representations.
Experimental Evaluations
To evaluate the performance of multimodal retrieval models, we utilized the ViDoRe Benchmark, a comprehensive collection designed for assessing document retrieval using visual features. This benchmark includes datasets formatted in a Question-Answering (QA) style to simulate realistic retrieval scenarios.
These datasets encompass a wide range of document types, including financial reports, legal documents, academic papers, manuals, and healthcare records. Each dataset presents unique challenges due to varying content complexity, layouts, and modality combinations.
Performance Comparison:
The table below summarizes the performance of various models across the ViDoRe datasets, measured by the Normalized Discounted Cumulative Gain at rank 5 (NDCG@5).
| Model Name | Average | TAT-DQA | Shift Project | Artificial Intelligence | Government Reports | ArxivQA | DocVQA | Healthcare Industry | InfoVQA | Energy | TabFQuad |
|---|---|---|---|---|---|---|---|---|---|---|---|
| ColQwen2 | 89.3 | 81.4 | 90.7 | 99.4 | 96.3 | 88.1 | 60.6 | 98.1 | 92.6 | 95.9 | 89.5 |
| ColPali | 81.3 | 65.8 | 73.2 | 96.2 | 92.7 | 79.1 | 54.4 | 94.4 | 81.8 | 91.0 | 83.9 |
| VISTA* | 70.8 | 56.9 | 78.6 | 86.8 | 89.3 | 39.4 | 32.2 | 91.1 | 75.0 | 87.7 | 71.2 |
| E5-Large* | 65.0 | 51.0 | 61.1 | 87.9 | 84.8 | 34.0 | 27.8 | 85.5 | 63.5 | 81.6 | 73.1 |
| BGE-M3* | 67.0 | 43.8 | 73.1 | 88.8 | 80.4 | 35.7 | 32.9 | 91.3 | 71.9 | 83.3 | 69.1 |
| BM25 | 65.5 | 62.7 | 64.3 | 92.8 | 83.9 | 31.6 | 36.8 | 87.2 | 62.9 | 85.9 | 46.5 |
| SigLIP | 51.4 | 26.2 | 18.7 | 62.5 | 66.1 | 43.2 | 30.3 | 79.1 | 64.1 | 65.7 | 58.1 |
| Jina-CLIP | 17.7 | 3.3 | 3.8 | 15.2 | 21.4 | 25.4 | 11.9 | 20.8 | 35.5 | 19.7 | 20.2 |
Note: Models marked with * (e.g., VISTA, E5-Large, BGE-M3) have been re-evaluated on the ViDoRe Benchmark.
Observations:
-
Top Performer: The ColQwen2 model achieved the highest average NDCG@5 score of 89.3, outperforming other models across most datasets.
-
Strong Multimodal Performance: ColQwen2, VISTA and ColPali performed well across multiple datasets, showing robust results on specific domain datasets like Healthcare Industry and Artificial Intelligence.
-
Text vs. Vision Models: Traditional text-based models such as BGE-M3 and BM25 showed competitive results on certain datasets but generally lagged behind multimodal models. Vision-only models like SigLIP and Jina-CLIP struggled significantly, especially on text-heavy datasets.
-
Dataset Variability: The performance variance across datasets indicates that some models are better suited for specific domains. For instance, ColQwen2 excelled in Government Reports (96.3) and Energy (95.9), suggesting robustness in handling domain-specific jargon and layouts.
Conclusion
The shift from unimodal to multimodal approaches in document retrieval is revolutionizing how we access complex information. Models like VISTA, ColPali, and ColQwen2 not only bridge the modality gap but also set new benchmarks for performance across diverse and complex datasets.
Key Takeaways:
- Multimodal Models Excel: Combining textual and visual features significantly improves retrieval accuracy, especially for documents with complex layouts.
- Advanced Models Address Modality Challenges: Models like ColPali and ColQwen2 create unified embedding spaces, allowing seamless integration of different data types.
- Importance of Domain Adaptation: High-performing models adapt well to various document types and domains, effectively handling specific jargon and layouts.
- Interpretability Matters: Interpretability is essential for user trust and compliance, with models like ColPali providing transparent retrieval processes through attention-based heatmaps.
- Innovative Evaluation is Crucial: New benchmarking strategies and evaluation metrics are vital for assessing the strengths of multimodal models in complex retrieval tasks.
“The modality gap isn’t just being bridged—it’s being obliterated.”
“The future is bright, and it’s multimodal.”